


BurnDownChart in Agile
What is BurnDownChart ?
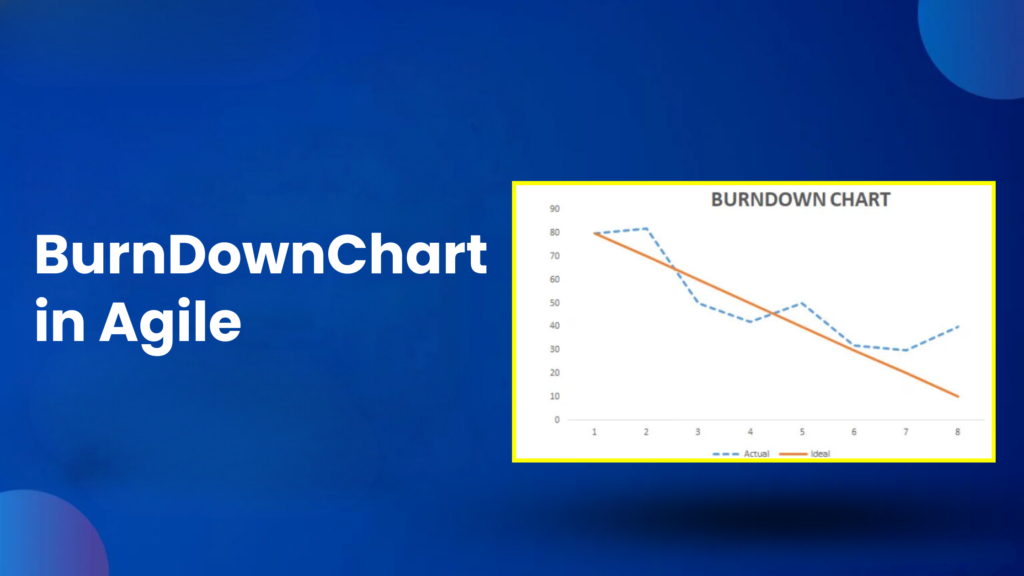
A BurnDownChart is a graphical way of representing the amount of work remaining with respect to time in a sprint. It helps in providing a visual information about the amount of work pending and also checking whether the team is on track with regards to meeting the objectives within the specified time period. By analysis the chart the agile team can detect issues related to scheduling, reasons for task delays and accordingly implement the strategies to increase the efficiency of the project.Below is the diagrammatic representation of BurnDown Chart.
Important Components of BurnDownChart
BurnDownChart consists of two axes and the lines that represent the ideal and actual tasks needed to be done.Other elements include starting point of task, the current date and the tasks that are completed.The below are the main components of BurnDownChart.
Horizontal Axis: The horizontal axis in burndown chart is known as the x axis which represents the time thus indicating the time duration of the project. This axis provides the time duration in an orderly manner.
Vertical Axis: The vertical axis is the y axis which signifies the amount of work pending. It is expressed in terms of units like hours,storypoints and tasks.The vertical axis displays the work left at every point of time. With the passage of project or sprint the amount of work left should decrease ideally thus making the axis move in downward direction in the chart.
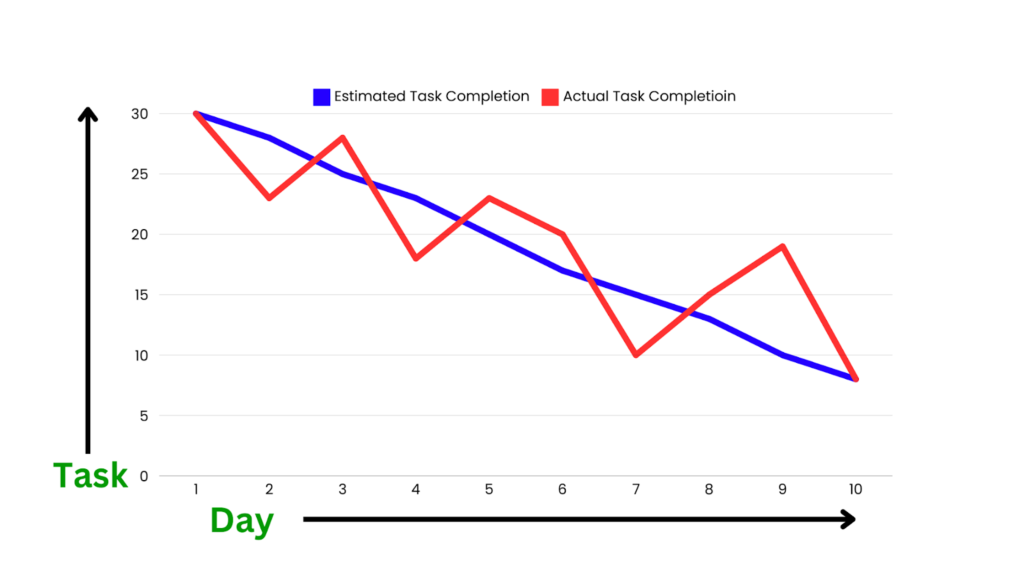
Estimated Task Pending: The expected or estimated task pending is the line on the chart starting from the highest point on y axis and ending at the lowest point on the x axis. The line touching the x axis at the end point shows the completion of task. This line represents the daily task progress needed on an average to meet the project objective within a specified time period.
Actual Task Pending: The actual task pending is a line on the burndown chart which represents the amount of work left to be completed which can vary with the estimated pending tasks. This line follows a non uniform path due to unexpected challenges in projects. When the actual tasks line moves ahead of estimated tasks line then it indicates that the task is completed within the scheduled time. This line acts as a guide in checking the overall performance of team.
Types of BurnDownCharts
There are two types of BurnDown Charts which are mentioned below:
- Sprint BurnDownCharts: This kind of BurnDown chart gives a visual display of all the progress made in the task at a particular sprint as well about the ongoing tasks.
- Product BurnDownCharts: This kind of BurnDown chart gives a visual display of the comprehensive progress of the task thus presenting the amount of task objectives achieved by the team and the number of tasks that are pending to be completed.
Procedure to Create a BurndownChart
Below are the following steps mentioned for creating an effective BurnDown Chart
- Determination of project scope- By estimating the time and effort required for completion of each iteration of project we can determine the scope of the project. Suppose a project needs to be completed within four months so we can divide the project into eight sprints where each sprint last for two weeks thus ensuring effective tracking of project progress and staying on track with the project completion deadline.
- Estimation of time requirements of project- The time duration needed to complete the tasks can be determined successfully through user stories and project scope. Make a detailed documentation of the team project performance analysis. This strategy enhances the reliability of burndown chart by making sure of proper calculation of time requirements.
- Marking of data points on chart- With the help of excel spreadsheets,create a burndown chart by marking the expected time duration or number of sprints on x axis and the user stories on y axis. Draw a straight line for the expected task remaining from the highest point of y axis to lowest point of x axis.
- Tracking of project progress- Project progress must be frequently tracked and plotted against the remaining track thus comparing the actual task done with the expected task done.
- Iterate and Refine-Perform continuous refinement of the chart and the calcuation process as per the feedback received for past iterations.
Advantages of BurnDownChart
The following are the advantages of BurnDown chart
- Visual Display of Task Progress- BurnDown chart provides a clear and easy to understand visual display of task progress. The line in the burndown chart clearly indicates whether the team will be able to complete the task within the specified time period. The downward movement of the line shows the decrease in pending tasks thus increasing motivation among the team.
- Enhances Transperency- The BurnDown chart increases transparency among the agile team members and various other stakeholders. Every person is able to see clearly the progress of tasks and the rapid completion of pending tasks with necessary modifcations. All the stakeholders can easily understand the project progress without focusing much on project details.
- Ensures effective collaboration among Agile team members- BurnDown charts can result in effective collaboration among agile team members. Daily stand up meetings regarding task updates from the chart can result in identification and fixing of critical issues at early stages of project development.
- Helps in early identification of issues-Any changes from the expected burndown chart line can result in severe problems thus affecting the productivity of agile team. So due to Burndown chart issues are identified at early stages of project thus allowing team to make corrective measures before escalation of issue at later phase of project.
- Focus on delivery- BurnDown chart tracks visually the tasks completed by team in every sprint thus ensuring that the team remain studious on timely completion of projects.It also help in maintaining the project scope through visual representation of amount of tasks left versus the time left for task completion.
Disadvantages of BurnDownChart
The following are the disadvantages of BurnDown chart
- Oversimplification of complex projects can have limitations- BurnDown chart can make the complex projects extremely simple. As a result there is lack of focus on other important aspects of the project like dependencies of task, complexity of tasks,project quality and other unknown challenges associated with the project.
- Lack of focus towards quality of project- The continuous focus towards task completion can lead to more attention on project quantity and lack of focus on project quality. Agile team may rush in to complete the tasks within the specified time without focusing on quality of tasks.
- Accuracies depend on estimates- The accuracies of burndown chart depend heavily on the proper estimation of efforts needed for every task. Inaccurate estimation can create errors in the chart and lead to confusion among agile team members.
- Not suitable for all projects- Burndown charts may not be suitable for all kinds of projects. They are only applicable for those projects which have a systematically defined tasks and expected timelines for completion.
Conclusion
Burndown chart has proven to be a very useful and effective tool for project management in agile. With the help of burndown chart agile team can get a clear visual display of task progress with respect to time. Remember to practice, stay updated with the latest trends in Manual testing with API and SQL Course and maintain a positive attitude throughout your interview process. This chart help teams to detect the pending tasks, predict the completion of projects and identity the issues that are delaying the projects and so on.
Also read:
Popular Courses


Upskill Yourself
Consult Us
Consult Us